viewer-900x900-900x731

Viewer, Analyze, and Redlining Software

Menu

Efficient Collaboration for the Design Review Process

Redlining and viewer software are essential tools that enable project teams to collaborate and communicate on design projects, whether for engineering or manufacturing purposes. By allowing teams to review, mark up, and comment on project documents and designs, redlining software streamlines the review process and ensures all stakeholders are on the same page. On the other hand, viewer software allows teams to easily access, view, and interact with project documents and designs in a centralized location. With these powerful tools, project teams can improve communication, reduce errors, and increase efficiency throughout the project lifecycle. Explore the redlining, analysis, and viewer tools from the E3.series tool suite.

Efficient Collaboration for the Design Review Process

Service and Production Integration

For after-sales and service, some organizations use dedicated software systems for managing exploded assembly drawings, wiring diagrams, and stock information. The E3.viewerPlus is an intelligent viewer that integrates directly with such systems, enabling you to retrieve electrical, hydraulic, and pneumatic design data directly.

It contains all the functionality of E3.viewer and additional features to set visibility within the project. Users can toggle visible layers on and off and change the displayed language within the project file. Configuring the menu and adding reports requested by the customer is also possible.

Free E3.viewer

E3.viewer allows you to distribute E3.series projects as original data. This ensures accurate exchange of data with production, service, suppliers, and customers, while providing powerful E3.series functionality, e.g. Search, Jump, Device Properties.

Download

Installation and Maintenance

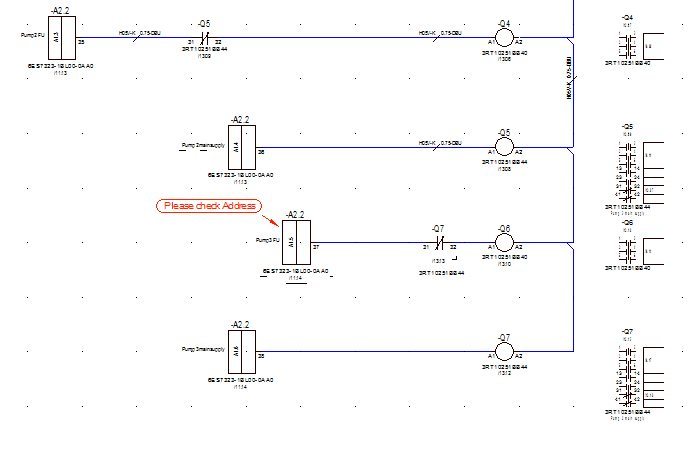
Products assembled and tested away from the design location or at an end-user site often require modifications. Documenting this can be very time-consuming, as all changes need to be re-drawn in the original files. Using E3.redliner, engineers can add improvements made during assembly as a graphical overlay to the original E3.series design or a special viewer file.

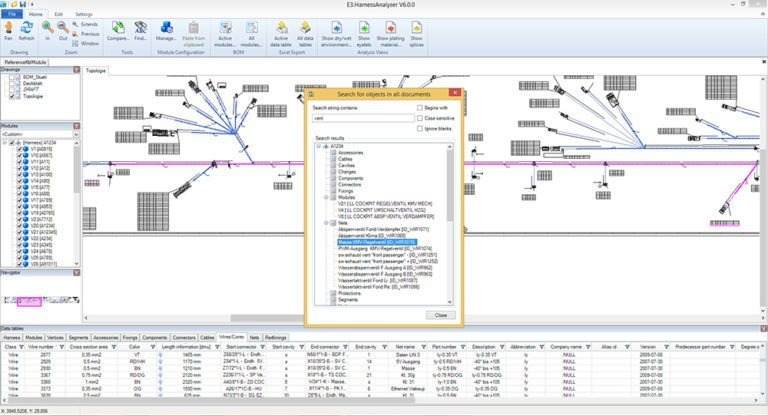
Production feedback can be shared using a redlining file to deliver the modification references to the development department. Search functions make it easy to find the modifications in the original design, which the engineer then integrates into the main design file. This process ensures consistency between the original documentation and the product installed in the field.

E3.redliner

Datasheet: E3.series Viewer Family

E3.view, E3.viewPlus, E3.redliner

Download

E3.connectivity viewer

Dynamic Connectivity Visualization

E3.ConnectivityBrowser is a plugin that allows users to have a standardized visualization of the defined connectivity across the schematics and views interactively. These standardized visualizations help streamline the consumption of cable and wire data irrespective of the complexity of the wiring diagrams. This information can be based on logical or physical connections and is configurable. The information forms easy-to-navigate blocks and black boxes to create a dynamic hierarchical view of the design – ready for exploration.

Benefits: Simplifying the data model is the most striking benefit among many.

  • Consistent and standardized diagrams driven by the schematic design data
  • Troubleshooting and verifying wiring connections
  • Incremental and logical exploration of design
  • Simply, easy-to-use UI
  • PDF export and print capabilities to share simplified perspectives

Viewing and Analyzing Wire Harness Drawings

E3.HarnessAnalyzer paves the way for harness design collaboration in the demanding automotive, special vehicles, and wider transportation industries. It is easy to use and allows efficient viewing, browsing, analyzing, validating, and commenting on the design model and related drawings generated by today’s growing number of authoring tools. The tool enables OEMs to optimize their process chain and collaborate with their suppliers. It allows detailed harness data to be available to all stakeholders, such as release engineers, quality inspectors, and production planners.

  • Share and analyze detailed harness assembly data created by different authoring tools
  • Read KBL, VEC, HCV, and other design data formats
  • Visualize wire harnesses and variants in 2D and 3D
  • Manage configurations based on modules for customer-specific wire harnesses (KSK)​

E3.harness analyzer

Features & Benefits

Leveraging the 3D coordinates in the imported data (KBL, VEC, or PLMXML), E3.HarnessAnalyzer can render wiring harnesses as a full 3D model. When including the 2D drawing in the import data (HVC or DSI), the tool can also visualize the detailed 2D drawing in high-resolution and XXL-scale formats (e.g., 1m x 60m).

HCV extends the industry-standard KBL (physical data model) and SVG (vector graphics) data. A key benefit is an ability to manage configurations based on modules for customer-specific harnesses (KSK). These features provide a new level of ease of use when sharing the comprehensive harness design model and documents with internal or external project teams.

With today’s large designs and drawings, the search function has become a major day-to-day requirement. E3.HarnessAnalyzer supports this with a powerful search engine functionality across all technical objects of a design.

Design collaboration typically involves fast manual detection of changes made by other designers when a new harness drawing version is released. E3.HarnessAnalyzer quickly and automatically compares two versions of the same document and cross-highlights the drawing to show differences. Users can export the comparison results to Microsoft Excel.

With E3.HarnessAnalyzer users can mark up documents with textual comments structured by classes such as “error” or “confirmation” displayed as flags in the drawing. Users can export all annotations for downstream processing, such as design review in the original authoring system or archiving for change management.

Master harness drawings may contain module families along with their modules. E3.HarnessAnalyzer displays the related information on module families and modules according to STEP AP212 KBL data structure, including the module history. Users can use the module structure to filter the information in views and lists for a single module or any combination of modules.

In addition to topological information, KBL, VEC, and PLMXML data contain connectivity information of wire harnesses and their components. Leveraging this information, E3.HarnessAnalyzer can generate wiring diagram views applying user-defined filter criteria. The wiring diagram is then automatically compiled in a fraction of a second. The generated diagram is fully linked to the 2D and 3D views.

Supported import formats include native PLMXML and DSI capabilities. In addition, E3.HarnessAnalyzer now supports importing data in the latest VEC (Vehicle Electric Container) industry-standard format. It enables review and inspection capabilities for comprehensive 150% wire harness designs, including their full options and variants.

Got a Question? - Contact Zuken today

For more information on how Zuken can help your design process, contact Zuken today.
Contact us today